Local Data Analytics Stack (Airflow + Superset)
At work, the BI environment is often setup and ready to go. At home, when I need to do data analysis myself, it really helps if there’s data pipeline and visualization tools ready to go. Over time, I’ve developed my go-to open source data analytics stack that runs on my local machine. The repo: https://github.com/l1990790120/local-data-stack is self-contained. In this post, I’ll share a bit more details on how it works and how to use it.
Background 
A typical data analytics workflow for me is usually consisted of:
- Airflow: orchestrate the steps to download, process data, and then load it into Postgres.
- Superset: data exploration and visualizations.
- Postgres: it’s used as backend of airflow and superset, as well as database to load our data to for analysis.
Sometimes, I’ll throw a jupyter notebook and h2o to do some further data exploration or building simple models.
Quick reminders
- you’ll need docker and docker-compose.
- everything I am doing here is based on osx so some command may be different if you are on linux.
Run Airflow, Superset, Postgres with Docker-Compose 
Thanks to the community of Airflow, Superset, Docker and Postgres, the docker-compose.yaml in the repo is mostly modified from:
- Airflow: https://github.com/puckel/docker-airflow
- Superset: https://github.com/amancevice/docker-superset/
- Postgres: https://hub.docker.com/_/postgres
To start:
- Clone the repository https://github.com/l1990790120/local-data-stack
- Go to repository directory
- run
docker-compose up -d.
Or, in your terminal, just run the following:
git clone git@github.com:l1990790120/local-data-stack.git
cd local-data-stack
docker-compose up -d
Suppose things are working as expected, you should see
- Airflow: http://localhost:8080/
- Superset: http://localhost:8088/
Note: You’ll need to initialize Superset for the first time.
docker exec -it local-data-stack_superset_1 superset-init
JHU Covid Dataset Example 
Let’s go through an example on how you can use these. There’s a lot of articles and models built for Covid-19. I am not a public health expert so I’ll reframe from publishing any conclusion. However, I am still interested to just look at the data.
JHU has published repository with all the data that backs up their trend visualization here:
https://github.com/CSSEGISandData/COVID-19.
Everyday, they publish a csv back to 2020-01-22:
https://github.com/CSSEGISandData/COVID-19/tree/master/csse_covid_19_data/csse_covid_19_daily_reports
Now, I want to download the data and load it to my local postgres to do some simple visualization. Thankfully, Airflow already has functionality that allows you to set a start date and run workflow iteratively back from current date to start date.
I already implemented the DAG in https://github.com/l1990790120/local-data-stack/blob/master/dags/covid_example.py, however, if you are interested in the details.
In CovidLoadDataDag, simply tweak the start date and schedule interval, Airflow will catchup to download and load each historical daily file.
    start_date = datetime(2020, 1, 22, 0, 0)
    end_date = datetime(2020, 2, 29, 0, 0)
    schedule_interval = "@daily"
    catchup = True
Once everything’s loaded (all green on Airflow), go to your Superset, we can do some quick visualization with just a few clicks.
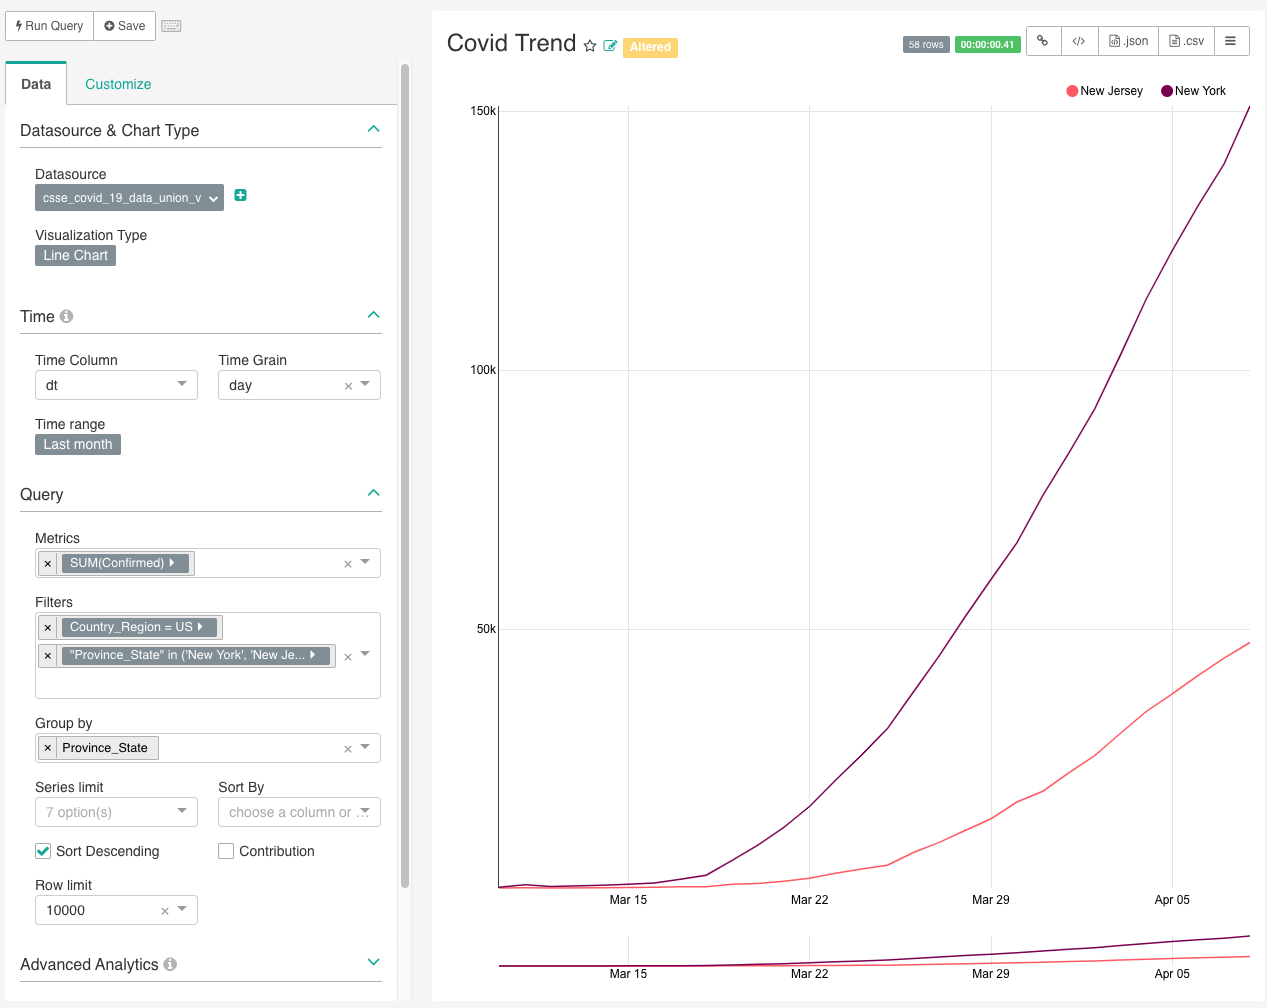
Nice isn’t it? You can drill down on different state, maybe chart out dod trend as well.
Conclusion 
That’s all! I hope you found this useful. Make this yours. Next time if you have a data project, I hope you can explore data a lot faster with this setup. Happy coding!